Headroom shows where your RAM, CPU and GPU go, in one window that is cheap enough to leave open. It sits in the top bar as a RAM percentage with a bar that turns green, amber or red with memory pressure, and a click opens the window.
I built it because I couldn't find a monitor that showed all three and stayed under 1% CPU. It's written in Rust with gpui, the UI framework from the Zed editor. On Linux it uses 0.05% CPU and 30 MB of RAM in the top bar, and around 1% with the window open.
What it shows
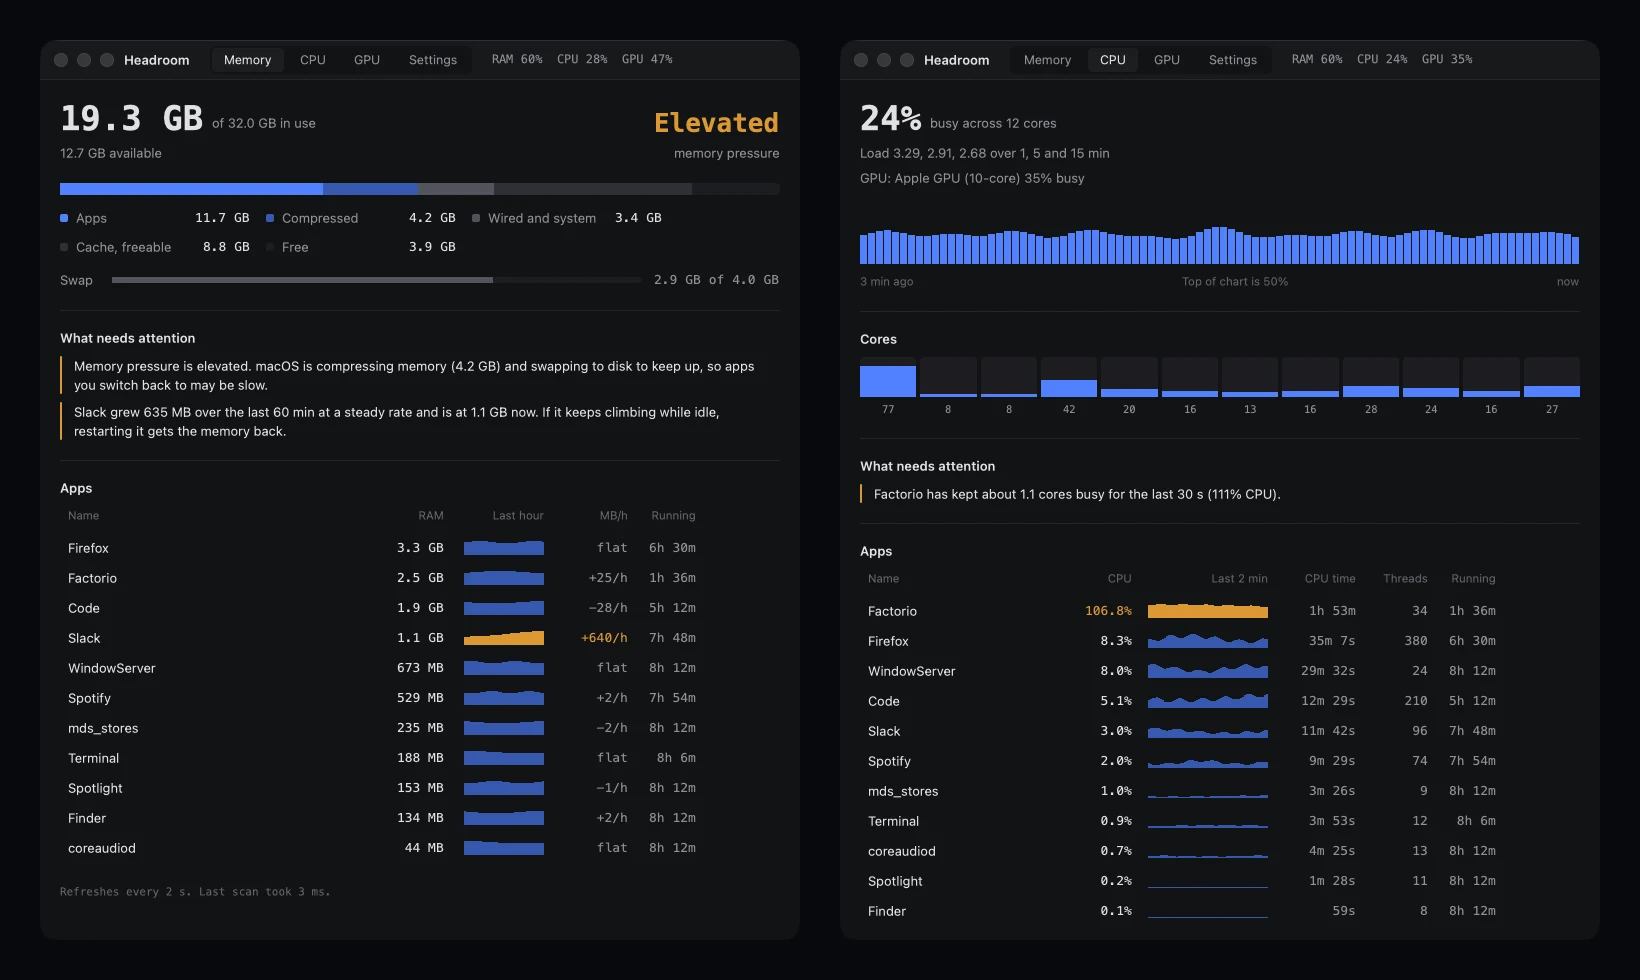
- Memory: what is using RAM (apps, GPU and shared memory, kernel, cache, free) and swap, with a 1-hour trend per app in MB per hour to catch leaks
- Why apps get killed: on Linux, memory pressure next to the systemd-oomd kill limit, and every out-of-memory kill from the last 7 days
- CPU: total, load average, a meter per core and per-app CPU, plus temperature and clock speed on Linux
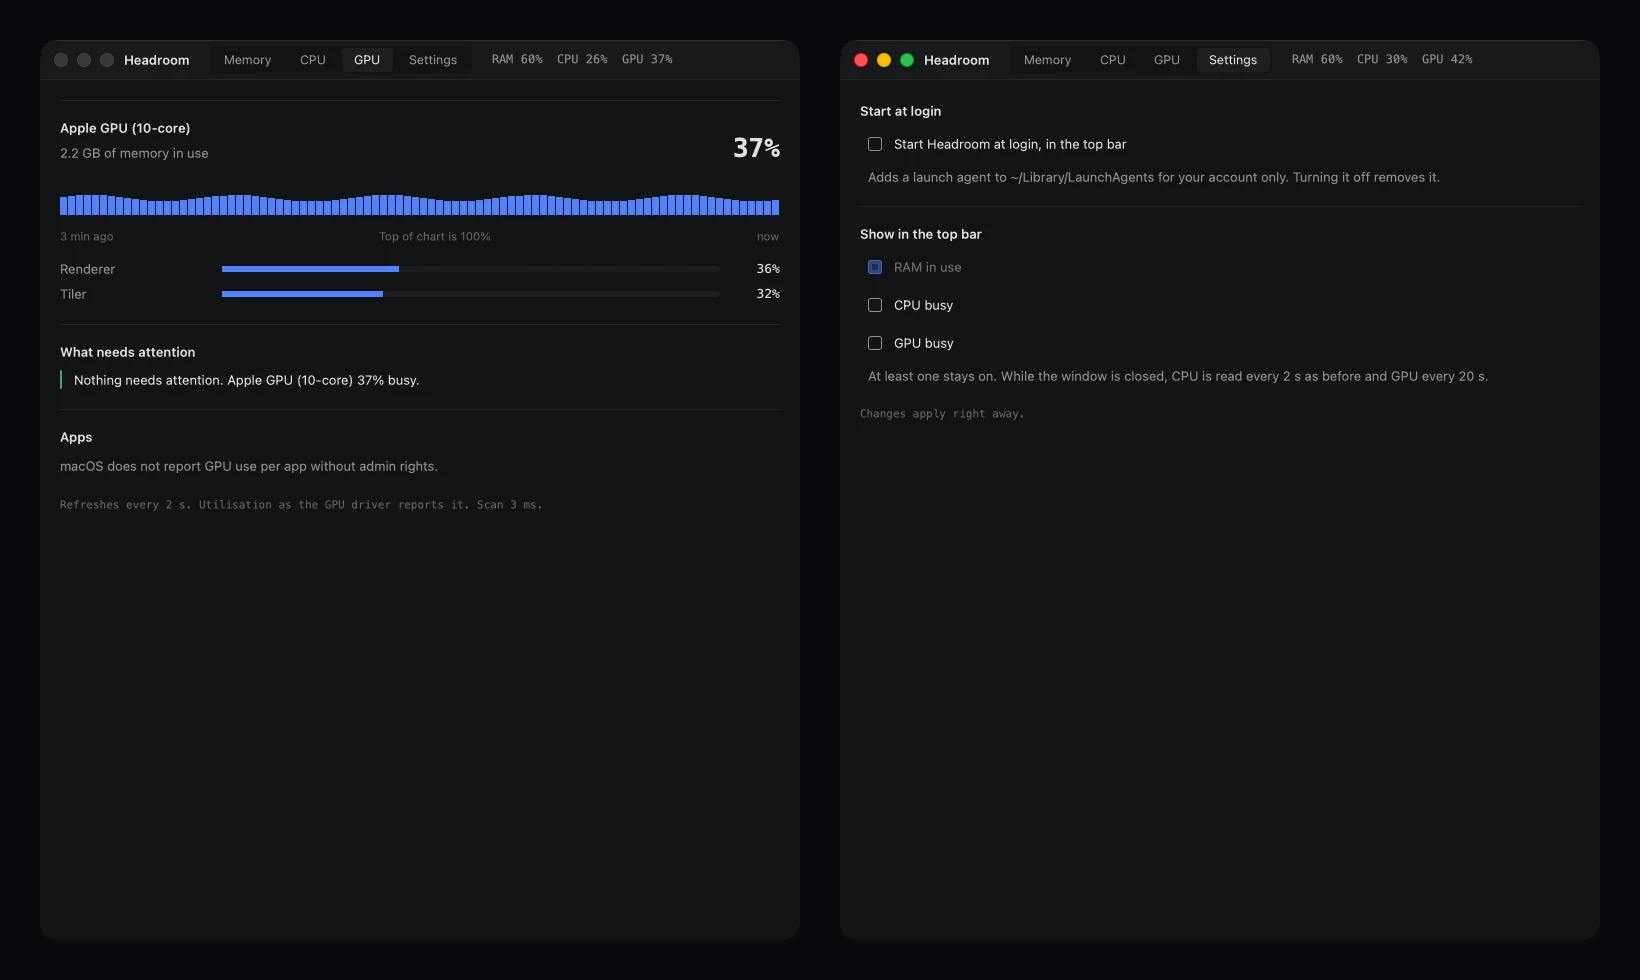
- GPU: how busy each GPU is, with VRAM, temperature, power and per-app usage on Linux
- Board sensors on Dell laptops: the temperatures and fans next to the memory, CPU and discrete GPU
In Settings you choose whether it starts at login and which values the top bar shows: RAM, CPU, GPU or any mix. It also sends a notification when memory gets tight, and headroom --dump prints the same report in a terminal.
The screenshots here are from demo mode, headroom --demo, which shows a simulated machine so no real computer ends up in a picture.
How it stays cheap
It reads the cheapest file that answers the question, scans every 2 seconds with the window open and every 20 seconds in the top bar, never wakes a sleeping NVIDIA card just to ask if it's busy, and only draws frames while something on screen is moving. I wrote up what I learned building it.
macOS
It runs on Apple Silicon too, with a menu bar item in place of the tray icon. macOS has no public source for some of what Linux exposes, so the kill history, temperatures and per-app GPU are left out there, and it costs more: about 2% CPU with the window open.