Headroom: a system monitor in Rust and gpui that costs about 1% CPU
2026-11-11
I wanted one window that shows where my RAM, CPU and GPU are going, and I wanted it open all day. That second part was the problem. I looked for a tool that showed all three together and stayed out of the way, and I didn't find one I was happy to leave running. My bar was simple: under 1% CPU, or it's part of the problem it is supposed to show me.
So I wrote Headroom. It sits in the top bar as a RAM percentage, and the window behind it has a Memory tab, a CPU tab and a GPU tab.
Why Rust and gpui
The idea came from Discord. At the start of November, Discord's CTO said they are rebuilding the desktop client in Rust, with gpui for the interface in place of Electron. gpui is the GPU-accelerated UI framework the Zed team built for their editor.
If a company that size is betting its client on it, I wanted to know what it's like to build something small with it. A system monitor is a good test: it has to draw numbers, bars and charts that change every couple of seconds, and it has no excuse for being heavy.
What it shows
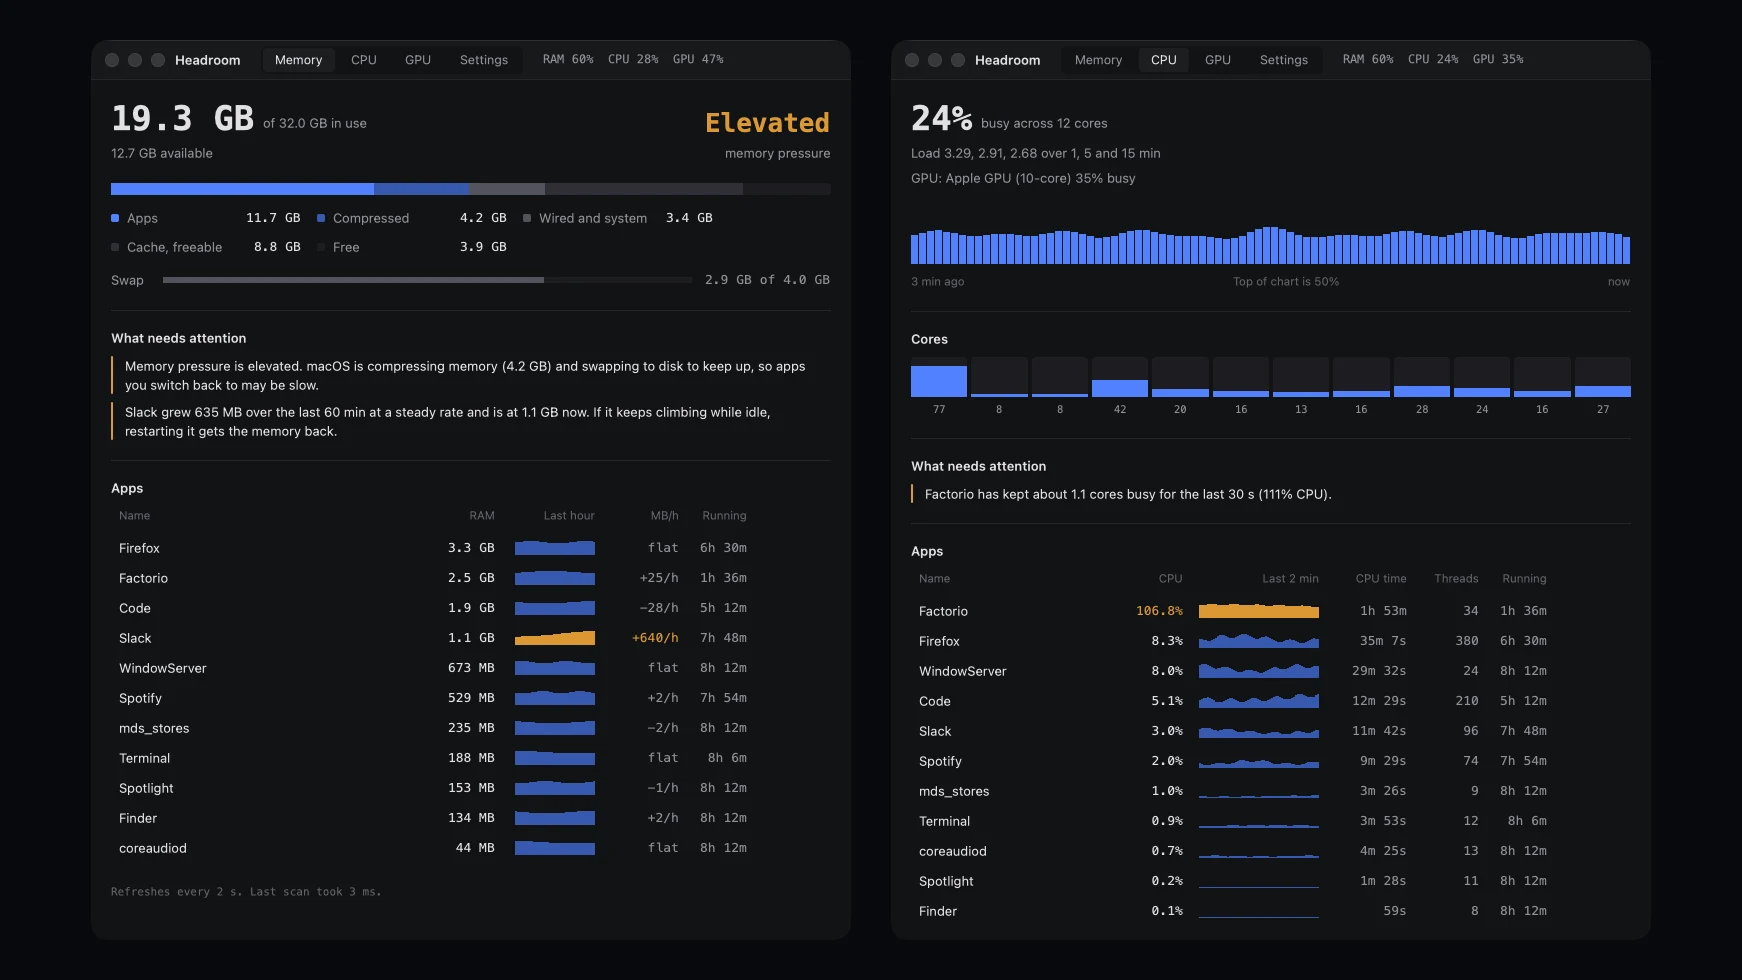
- Memory: RAM in use, a bar split into apps, GPU and shared memory, kernel, cache and free, plus swap. Under that, every app with its RAM, swap and a 1-hour trend in MB per hour, which is how you spot a leak.
- Why Linux is killing your apps: memory pressure next to the limit where systemd-oomd starts killing, and a list of every out-of-memory kill from the last 7 days.
- CPU: total, load average, temperature, clock speed, a meter per core, and per-app CPU.
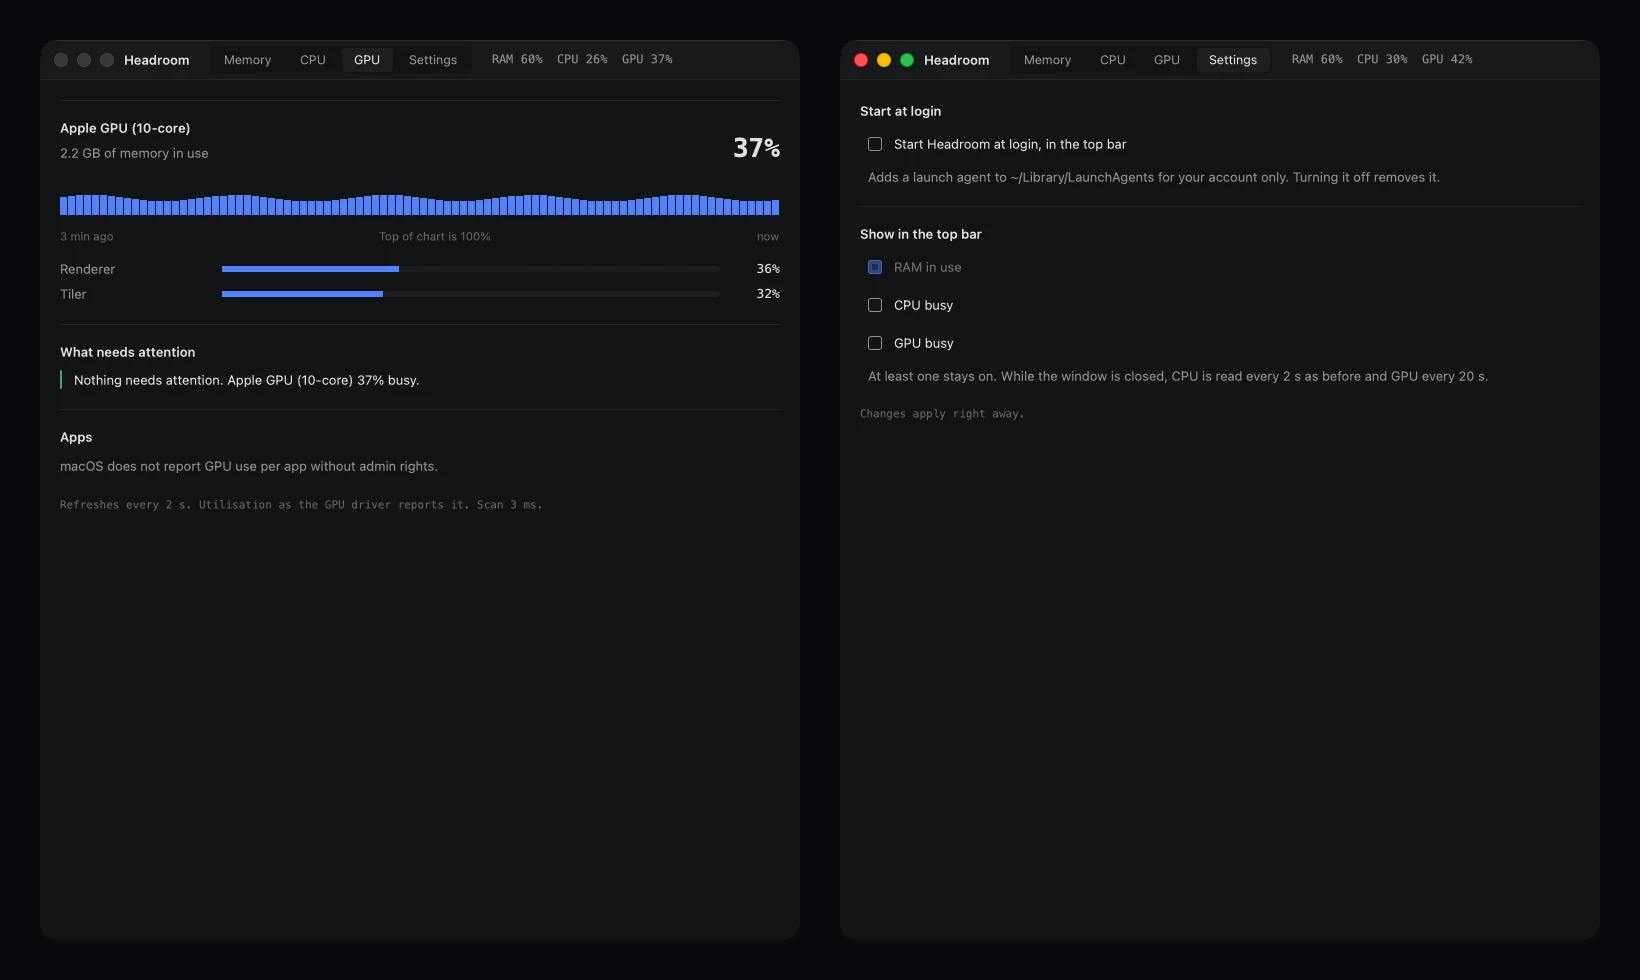
- GPU: how busy each GPU is, per engine, and for NVIDIA also VRAM, temperature and power, with per-app usage.
What it costs
I measured it on my Linux laptop with about 575 processes running.
| CPU | Own RAM | |
|---|---|---|
| In the top bar | 0.05% | 30 MB |
| Window open, Memory tab | about 0.6% | 38 MB |
| Window open, CPU tab | about 1.1% | |
| Window open, GPU tab | about 0.7% |
So it's under 1% on two tabs and just over on the third. The CPU tab is the expensive one because that is where per-app CPU and GPU get measured.
Where the time went
Almost none of the work was drawing. It was deciding what not to read, and when not to draw.
Read the cheap file. The process scan reads /proc/PID/status and nothing else. The more precise smaps_rollup walks page tables, and on Electron apps it was 6 times slower. A full scan takes about 6 ms. It runs every 2 seconds with the window open and every 20 seconds in the top bar.
Don't wake the GPU to ask if it's busy. Querying a sleeping NVIDIA card through NVML wakes it up, which is the opposite of what a monitor should do. Headroom checks the card's power state first and shows "asleep" if it is.
Animation was the most expensive feature. Numbers and bars ease to their new values instead of jumping. My first version kept easing until the remaining move was tiny, which meant it was drawing for 1.3 seconds out of every 2 and cost about 6% CPU. Now it stops as soon as the rest of the move would be under half a pixel, and frames are only drawn while something is moving.
Slow sensors get their own thread. On my Dell, reading the board temperatures and fans from the firmware takes 70 to 80 ms. A background thread does it every 10 seconds, and only while the window is open.
Wait, don't poll. New out-of-memory kills come from one journalctl -f process that blocks until something is logged. Clicks on the top-bar icon arrive on a channel the app waits on.
What gpui doesn't give you yet
gpui 0.2.2 has no accessibility support, so a screen reader sees an empty window. I didn't want to ship that, so Headroom publishes its own accessibility tree through AccessKit: every number, the tabs and the Quit buttons.
I also had to patch two dependencies to get a clean build, and both patches are in the repo with a note on why.
None of that put me off. 38 MB and about 1% CPU for a window full of live charts is the kind of number I wanted.
It runs on macOS too
I built it on Linux, then ported it to Apple Silicon. It needs only the Command Line Tools to build, and a menu bar item takes the place of the tray icon.
Two things are worse there. macOS has no public way to read temperatures, per-app GPU use or which apps were killed for memory, so those parts are hidden. And it costs more: about 1.7% CPU on the Memory tab and 2.3% on the CPU tab on an M1, because gpui keeps a display link running whenever a window is visible. That one is still on my list.
Screenshots without my machine in them
A monitor's screenshots show everything you have running. So there is a demo mode, headroom --demo, that fills every tab with a simulated machine and reads nothing from the real one. Every picture of Headroom on this site and on GitHub comes from it, including the Memory and CPU tabs at the top of this post and the GPU tab and Settings below.
Get it
Headroom is open source under the MIT license: github.com/bernisnukic/headroom. The README has the install steps and the full list of what each tab shows.